|
Download Data (XLS File) |
|
||||||||
|
||||||||
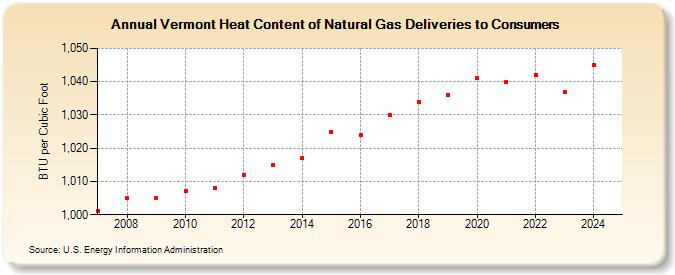
| Vermont Heat Content of Natural Gas Deliveries to Consumers (BTU per Cubic Foot) | ||||||||
| Decade | Year-0 | Year-1 | Year-2 | Year-3 | Year-4 | Year-5 | Year-6 | Year-7 | Year-8 | Year-9 |
|---|---|---|---|---|---|---|---|---|---|---|
| 2000's | 1,001 | 1,005 | 1,005 | |||||||
| 2010's | 1,007 | 1,008 | 1,012 | 1,015 | 1,017 | 1,025 | 1,024 | 1,030 | 1,034 | 1,036 |
| 2020's | 1,041 | 1,040 | 1,042 | 1,037 | 1,044 | 1,048 |
| - = No Data Reported; -- = Not Applicable; NA = Not Available; W = Withheld to avoid disclosure of individual company data. |
| Release Date: 6/30/2026 |
| Next Release Date: 7/31/2026 |