|
Download Data (XLS File) |
|
||||||||
|
||||||||
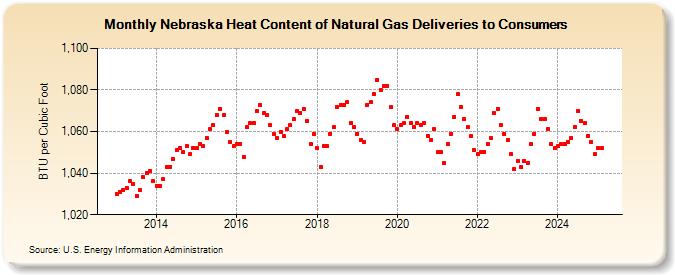
| Nebraska Heat Content of Natural Gas Deliveries to Consumers (BTU per Cubic Foot) | ||||||||
| Year | Jan | Feb | Mar | Apr | May | Jun | Jul | Aug | Sep | Oct | Nov | Dec |
|---|---|---|---|---|---|---|---|---|---|---|---|---|
| 2013 | 1,030 | 1,031 | 1,032 | 1,033 | 1,036 | 1,035 | 1,029 | 1,032 | 1,038 | 1,040 | 1,041 | 1,036 |
| 2014 | 1,034 | 1,034 | 1,037 | 1,043 | 1,043 | 1,047 | 1,051 | 1,052 | 1,050 | 1,053 | 1,049 | 1,052 |
| 2015 | 1,052 | 1,054 | 1,053 | 1,057 | 1,061 | 1,063 | 1,068 | 1,071 | 1,068 | 1,060 | 1,055 | 1,053 |
| 2016 | 1,054 | 1,054 | 1,048 | 1,062 | 1,064 | 1,064 | 1,070 | 1,073 | 1,069 | 1,068 | 1,063 | 1,059 |
| 2017 | 1,057 | 1,060 | 1,058 | 1,061 | 1,063 | 1,066 | 1,070 | 1,069 | 1,071 | 1,065 | 1,054 | 1,059 |
| 2018 | 1,052 | 1,043 | 1,053 | 1,053 | 1,059 | 1,062 | 1,072 | 1,073 | 1,073 | 1,074 | 1,064 | 1,062 |
| 2019 | 1,059 | 1,056 | 1,055 | 1,073 | 1,074 | 1,078 | 1,085 | 1,080 | 1,082 | 1,082 | 1,072 | 1,063 |
| 2020 | 1,061 | 1,063 | 1,064 | 1,067 | 1,064 | 1,062 | 1,064 | 1,063 | 1,064 | 1,058 | 1,056 | 1,061 |
| 2021 | 1,050 | 1,050 | 1,045 | 1,054 | 1,059 | 1,067 | 1,078 | 1,072 | 1,066 | 1,062 | 1,058 | 1,051 |
| 2022 | 1,049 | 1,050 | 1,050 | 1,054 | 1,057 | 1,069 | 1,071 | 1,063 | 1,059 | 1,056 | 1,049 | 1,042 |
| 2023 | 1,046 | 1,043 | 1,046 | 1,045 | 1,054 | 1,059 | 1,071 | 1,066 | 1,066 | 1,061 | 1,054 | 1,052 |
| 2024 | 1,053 | 1,054 | 1,054 | 1,055 | 1,057 | 1,062 | 1,070 | 1,065 | 1,064 | 1,058 | 1,055 | 1,049 |
| 2025 | 1,052 | 1,052 | 1,048 | 1,053 | 1,057 | 1,061 | 1,064 | 1,062 | 1,066 | 1,057 | 1,059 | 1,050 |
| 2026 | 1,049 | 1,051 | 1,051 | 1,061 | ||||||||
| - = No Data Reported; -- = Not Applicable; NA = Not Available; W = Withheld to avoid disclosure of individual company data. |
| Release Date: 6/30/2026 |
| Next Release Date: 7/31/2026 |