|
Download Data (XLS File) |
|
||||||||
|
||||||||
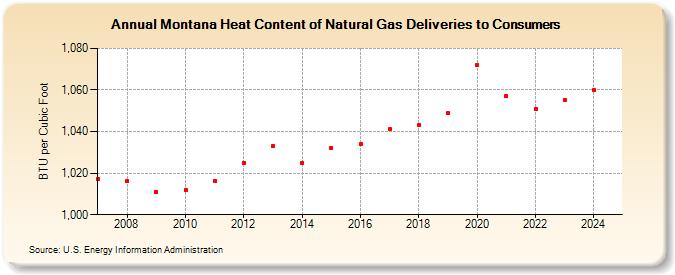
| Montana Heat Content of Natural Gas Deliveries to Consumers (BTU per Cubic Foot) | ||||||||
| Decade | Year-0 | Year-1 | Year-2 | Year-3 | Year-4 | Year-5 | Year-6 | Year-7 | Year-8 | Year-9 |
|---|---|---|---|---|---|---|---|---|---|---|
| 2000's | 1,017 | 1,016 | 1,011 | |||||||
| 2010's | 1,012 | 1,016 | 1,025 | 1,033 | 1,025 | 1,032 | 1,034 | 1,041 | 1,043 | 1,049 |
| 2020's | 1,072 | 1,057 | 1,051 | 1,055 | 1,058 | 1,062 |
| - = No Data Reported; -- = Not Applicable; NA = Not Available; W = Withheld to avoid disclosure of individual company data. |
| Release Date: 6/30/2026 |
| Next Release Date: 7/31/2026 |