|
Download Data (XLS File) |
|
||||||||
|
||||||||
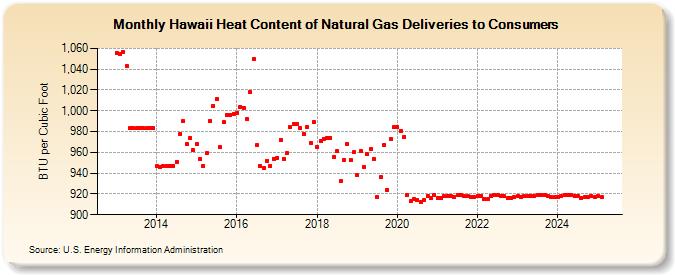
| Hawaii Heat Content of Natural Gas Deliveries to Consumers (BTU per Cubic Foot) | ||||||||
| Year | Jan | Feb | Mar | Apr | May | Jun | Jul | Aug | Sep | Oct | Nov | Dec |
|---|---|---|---|---|---|---|---|---|---|---|---|---|
| 2013 | 1,056 | 1,055 | 1,057 | 1,043 | 983 | 983 | 983 | 983 | 983 | 983 | 983 | 983 |
| 2014 | 947 | 946 | 947 | 947 | 947 | 947 | 951 | 978 | 990 | 968 | 974 | 962 |
| 2015 | 968 | 954 | 947 | 959 | 990 | 1,005 | 1,011 | 965 | 989 | 996 | 996 | 997 |
| 2016 | 998 | 1,004 | 1,003 | 992 | 1,018 | 1,050 | 967 | 947 | 945 | 952 | 947 | 954 |
| 2017 | 955 | 972 | 954 | 959 | 984 | 987 | 987 | 983 | 978 | 984 | 969 | 989 |
| 2018 | 965 | 971 | 973 | 974 | 974 | 956 | 961 | 932 | 953 | 968 | 953 | 960 |
| 2019 | 938 | 961 | 946 | 958 | 963 | 954 | 917 | 936 | 967 | 924 | 973 | 984 |
| 2020 | 984 | 981 | 975 | 919 | 913 | 915 | 914 | 912 | 914 | 918 | 916 | 919 |
| 2021 | 916 | 916 | 918 | 918 | 918 | 917 | 919 | 919 | 918 | 918 | 917 | 917 |
| 2022 | 918 | 918 | 915 | 915 | 918 | 919 | 919 | 918 | 918 | 916 | 916 | 917 |
| 2023 | 918 | 917 | 918 | 918 | 918 | 918 | 919 | 919 | 919 | 918 | 917 | 917 |
| 2024 | 917 | 918 | 919 | 919 | 919 | 918 | 918 | 916 | 917 | 917 | 918 | 917 |
| 2025 | 918 | 917 | 917 | 917 | 916 | 916 | 917 | 917 | 918 | 917 | 918 | 917 |
| 2026 | 918 | 918 | 917 | 969 | ||||||||
| - = No Data Reported; -- = Not Applicable; NA = Not Available; W = Withheld to avoid disclosure of individual company data. |
| Release Date: 6/30/2026 |
| Next Release Date: 7/31/2026 |