|
Download Data (XLS File) |
|
||||||||
|
||||||||
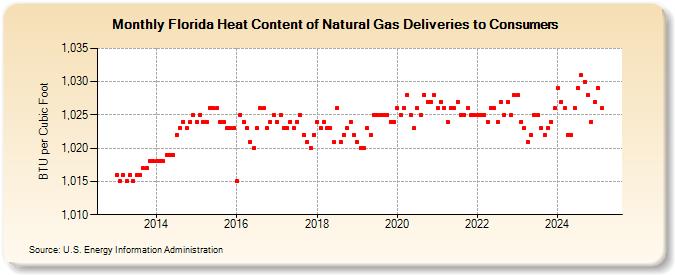
| Florida Heat Content of Natural Gas Deliveries to Consumers (BTU per Cubic Foot) | ||||||||
| Year | Jan | Feb | Mar | Apr | May | Jun | Jul | Aug | Sep | Oct | Nov | Dec |
|---|---|---|---|---|---|---|---|---|---|---|---|---|
| 2013 | 1,016 | 1,015 | 1,016 | 1,015 | 1,016 | 1,015 | 1,016 | 1,016 | 1,017 | 1,017 | 1,018 | 1,018 |
| 2014 | 1,018 | 1,018 | 1,018 | 1,019 | 1,019 | 1,019 | 1,022 | 1,023 | 1,024 | 1,023 | 1,024 | 1,025 |
| 2015 | 1,024 | 1,025 | 1,024 | 1,024 | 1,026 | 1,026 | 1,026 | 1,024 | 1,024 | 1,023 | 1,023 | 1,023 |
| 2016 | 1,015 | 1,025 | 1,024 | 1,023 | 1,021 | 1,020 | 1,023 | 1,026 | 1,026 | 1,023 | 1,024 | 1,025 |
| 2017 | 1,024 | 1,025 | 1,023 | 1,023 | 1,024 | 1,023 | 1,024 | 1,025 | 1,022 | 1,021 | 1,020 | 1,022 |
| 2018 | 1,024 | 1,023 | 1,024 | 1,023 | 1,023 | 1,021 | 1,026 | 1,021 | 1,022 | 1,023 | 1,024 | 1,022 |
| 2019 | 1,021 | 1,020 | 1,020 | 1,023 | 1,022 | 1,025 | 1,025 | 1,025 | 1,025 | 1,025 | 1,024 | 1,024 |
| 2020 | 1,026 | 1,025 | 1,026 | 1,028 | 1,025 | 1,023 | 1,026 | 1,025 | 1,028 | 1,027 | 1,027 | 1,028 |
| 2021 | 1,026 | 1,027 | 1,026 | 1,024 | 1,026 | 1,026 | 1,027 | 1,025 | 1,025 | 1,026 | 1,025 | 1,025 |
| 2022 | 1,025 | 1,025 | 1,025 | 1,024 | 1,026 | 1,026 | 1,024 | 1,027 | 1,025 | 1,027 | 1,025 | 1,028 |
| 2023 | 1,028 | 1,024 | 1,023 | 1,021 | 1,022 | 1,025 | 1,025 | 1,023 | 1,022 | 1,023 | 1,024 | 1,026 |
| 2024 | 1,029 | 1,027 | 1,026 | 1,022 | 1,022 | 1,026 | 1,029 | 1,031 | 1,030 | 1,028 | 1,024 | 1,027 |
| 2025 | 1,029 | 1,026 | 1,025 | 1,022 | 1,029 | 1,023 | 1,024 | 1,023 | 1,023 | 1,022 | 1,023 | 1,025 |
| 2026 | 1,023 | 1,028 | 1,022 | 1,025 | ||||||||
| - = No Data Reported; -- = Not Applicable; NA = Not Available; W = Withheld to avoid disclosure of individual company data. |
| Release Date: 6/30/2026 |
| Next Release Date: 7/31/2026 |