|
Download Data (XLS File) |
|
||||||||
|
||||||||
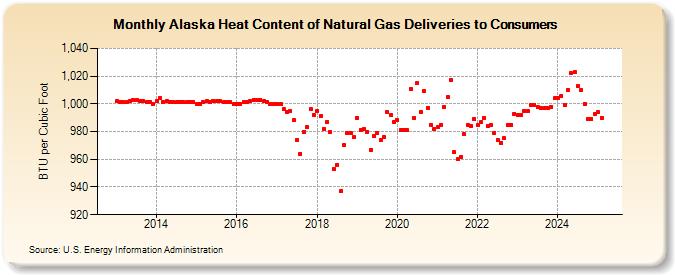
| Alaska Heat Content of Natural Gas Deliveries to Consumers (BTU per Cubic Foot) | ||||||||
| Year | Jan | Feb | Mar | Apr | May | Jun | Jul | Aug | Sep | Oct | Nov | Dec |
|---|---|---|---|---|---|---|---|---|---|---|---|---|
| 2013 | 1,002 | 1,001 | 1,001 | 1,001 | 1,002 | 1,003 | 1,003 | 1,002 | 1,002 | 1,001 | 1,001 | 1,000 |
| 2014 | 1,002 | 1,004 | 1,001 | 1,002 | 1,001 | 1,001 | 1,001 | 1,001 | 1,001 | 1,001 | 1,001 | 1,001 |
| 2015 | 1,000 | 1,000 | 1,001 | 1,002 | 1,001 | 1,002 | 1,002 | 1,002 | 1,001 | 1,001 | 1,001 | 1,000 |
| 2016 | 1,000 | 1,000 | 1,001 | 1,001 | 1,002 | 1,003 | 1,003 | 1,003 | 1,002 | 1,001 | 1,000 | 1,000 |
| 2017 | 1,000 | 1,000 | 996 | 994 | 995 | 988 | 974 | 964 | 980 | 983 | 996 | 992 |
| 2018 | 995 | 991 | 982 | 987 | 980 | 953 | 956 | 937 | 970 | 979 | 979 | 976 |
| 2019 | 990 | 981 | 982 | 980 | 967 | 977 | 979 | 974 | 976 | 994 | 992 | 987 |
| 2020 | 988 | 981 | 981 | 981 | 1,011 | 990 | 1,015 | 994 | 1,009 | 997 | 985 | 982 |
| 2021 | 983 | 985 | 998 | 1,005 | 1,017 | 965 | 960 | 962 | 978 | 985 | 984 | 989 |
| 2022 | 985 | 987 | 990 | 984 | 985 | 979 | 974 | 972 | 975 | 985 | 985 | 993 |
| 2023 | 992 | 992 | 995 | 995 | 999 | 999 | 998 | 997 | 997 | 997 | 998 | 1,004 |
| 2024 | 1,004 | 1,006 | 999 | 1,010 | 1,022 | 1,023 | 1,013 | 1,010 | 1,000 | 989 | 989 | 993 |
| 2025 | 994 | 990 | 986 | 983 | 980 | 985 | 1,007 | 985 | 983 | 984 | 989 | 992 |
| 2026 | 992 | 992 | 990 | 990 | ||||||||
| - = No Data Reported; -- = Not Applicable; NA = Not Available; W = Withheld to avoid disclosure of individual company data. |
| Release Date: 6/30/2026 |
| Next Release Date: 7/31/2026 |