|
Download Data (XLS File) |
|
||||||||
|
||||||||
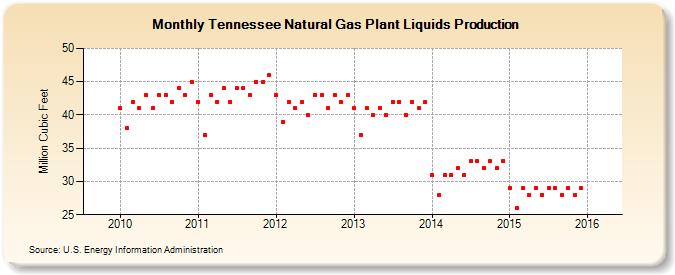
| Tennessee Natural Gas Plant Liquids Production (Million Cubic Feet) | ||||||||
| Year | Jan | Feb | Mar | Apr | May | Jun | Jul | Aug | Sep | Oct | Nov | Dec |
|---|---|---|---|---|---|---|---|---|---|---|---|---|
| 2010 | 41 | 38 | 42 | 41 | 43 | 41 | 43 | 43 | 42 | 44 | 43 | 45 |
| 2011 | 42 | 37 | 43 | 42 | 44 | 42 | 44 | 44 | 43 | 45 | 45 | 46 |
| 2012 | 43 | 39 | 42 | 41 | 42 | 40 | 43 | 43 | 41 | 43 | 42 | 43 |
| 2013 | 41 | 37 | 41 | 40 | 41 | 40 | 42 | 42 | 40 | 42 | 41 | 42 |
| 2014 | 31 | 28 | 31 | 31 | 32 | 31 | 33 | 33 | 32 | 33 | 32 | 33 |
| 2015 | 29 | 26 | 29 | 28 | 29 | 28 | 29 | 29 | 28 | 29 | 28 | 29 |
| - = No Data Reported; -- = Not Applicable; NA = Not Available; W = Withheld to avoid disclosure of individual company data. |
| Release Date: 6/30/2026 |
| Next Release Date: 7/31/2026 |