|
Download Data (XLS File) |
|
|||||
|
|||||
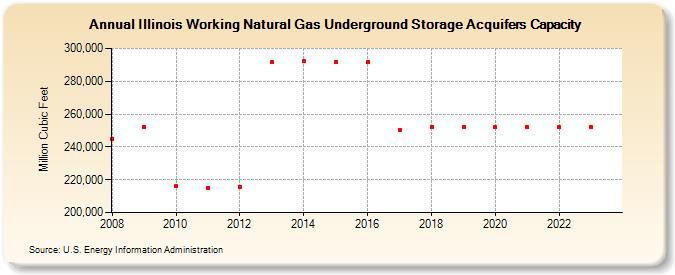
| Illinois Working Natural Gas Underground Storage Acquifers Capacity (Million Cubic Feet) | |||||
| Decade | Year-0 | Year-1 | Year-2 | Year-3 | Year-4 | Year-5 | Year-6 | Year-7 | Year-8 | Year-9 |
|---|---|---|---|---|---|---|---|---|---|---|
| 2000's | 244,900 | 252,344 | ||||||||
| 2010's | 216,132 | 215,017 | 215,594 | 291,544 | 292,544 | 291,845 | 291,845 | 250,505 | 251,845 | 251,845 |
| 2020's | 251,845 | 251,845 | 252,045 | 252,045 | 252,045 |
| - = No Data Reported; -- = Not Applicable; NA = Not Available; W = Withheld to avoid disclosure of individual company data. |
| Release Date: 6/30/2026 |
| Next Release Date: 7/31/2026 |