|
Download Data (XLS File) |
|
||||||||
|
||||||||
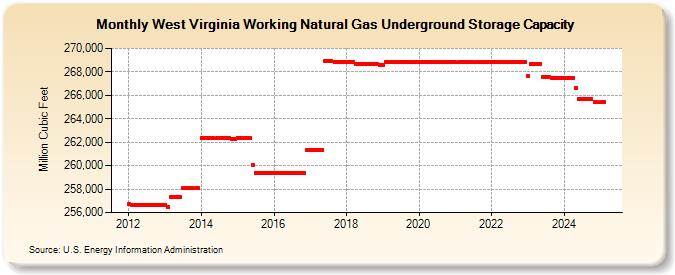
| West Virginia Working Natural Gas Underground Storage Capacity (Million Cubic Feet) | ||||||||
| Year | Jan | Feb | Mar | Apr | May | Jun | Jul | Aug | Sep | Oct | Nov | Dec |
|---|---|---|---|---|---|---|---|---|---|---|---|---|
| 2012 | 256,688 | 256,684 | 256,680 | 256,677 | 256,672 | 256,668 | 256,668 | 256,659 | 256,655 | 256,651 | 256,647 | 256,643 |
| 2013 | 256,640 | 256,454 | 257,322 | 257,319 | 257,315 | 257,311 | 258,072 | 258,068 | 258,064 | 258,060 | 258,056 | 258,056 |
| 2014 | 262,347 | 262,347 | 262,339 | 262,335 | 262,335 | 262,328 | 262,324 | 262,320 | 262,316 | 262,316 | 262,308 | 262,305 |
| 2015 | 262,367 | 262,367 | 262,367 | 262,367 | 262,367 | 260,060 | 259,390 | 259,390 | 259,390 | 259,387 | 259,387 | 259,381 |
| 2016 | 259,380 | 259,380 | 259,374 | 259,370 | 259,370 | 259,362 | 259,359 | 259,356 | 259,353 | 259,350 | 259,347 | 261,345 |
| 2017 | 261,343 | 261,341 | 261,337 | 261,337 | 261,335 | 268,894 | 268,884 | 268,884 | 268,882 | 268,882 | 268,882 | 268,869 |
| 2018 | 268,867 | 268,867 | 268,858 | 268,658 | 268,650 | 268,647 | 268,647 | 268,640 | 268,637 | 268,633 | 268,629 | 268,626 |
| 2019 | 268,624 | 268,813 | 268,810 | 268,810 | 268,803 | 268,803 | 268,803 | 268,803 | 268,803 | 268,803 | 268,803 | 268,803 |
| 2020 | 268,803 | 268,803 | 268,803 | 268,803 | 268,803 | 268,803 | 268,803 | 268,803 | 268,803 | 268,803 | 268,803 | 268,803 |
| 2021 | 268,803 | 268,803 | 268,803 | 268,803 | 268,803 | 268,803 | 268,803 | 268,803 | 268,803 | 268,803 | 268,803 | 268,803 |
| 2022 | 268,803 | 268,803 | 268,803 | 268,803 | 268,803 | 268,803 | 268,803 | 268,803 | 268,803 | 268,803 | 268,803 | 268,803 |
| 2023 | 267,621 | 268,696 | 268,693 | 268,689 | 268,685 | 267,526 | 267,523 | 267,520 | 267,517 | 267,515 | 267,511 | 267,508 |
| 2024 | 267,505 | 267,503 | 267,501 | 267,498 | 266,622 | 265,717 | 265,714 | 265,711 | 265,705 | 265,705 | 265,409 | 265,406 |
| 2025 | 265,403 | 265,400 | 264,555 | 264,481 | 264,481 | 264,478 | 264,475 | 264,472 | 264,469 | 264,467 | 264,466 | 264,463 |
| 2026 | 264,460 | 264,181 | 264,178 | 264,175 | ||||||||
| - = No Data Reported; -- = Not Applicable; NA = Not Available; W = Withheld to avoid disclosure of individual company data. |
| Release Date: 6/30/2026 |
| Next Release Date: 7/31/2026 |