|
Download Data (XLS File) |
|
||||||||
|
||||||||
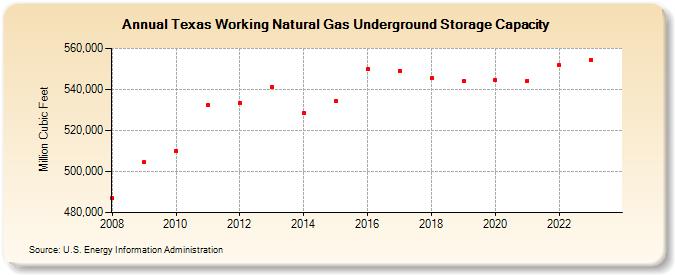
| Texas Working Natural Gas Underground Storage Capacity (Million Cubic Feet) | ||||||||
| Decade | Year-0 | Year-1 | Year-2 | Year-3 | Year-4 | Year-5 | Year-6 | Year-7 | Year-8 | Year-9 |
|---|---|---|---|---|---|---|---|---|---|---|
| 2000's | 486,876 | 504,524 | ||||||||
| 2010's | 509,961 | 532,336 | 533,336 | 541,161 | 528,485 | 534,539 | 549,887 | 549,049 | 545,640 | 543,975 |
| 2020's | 544,665 | 544,315 | 551,806 | 554,483 | 563,188 |
| - = No Data Reported; -- = Not Applicable; NA = Not Available; W = Withheld to avoid disclosure of individual company data. |
| Release Date: 6/30/2026 |
| Next Release Date: 7/31/2026 |
Referring Pages: