|
Download Data (XLS File) |
|
||||||||
|
||||||||
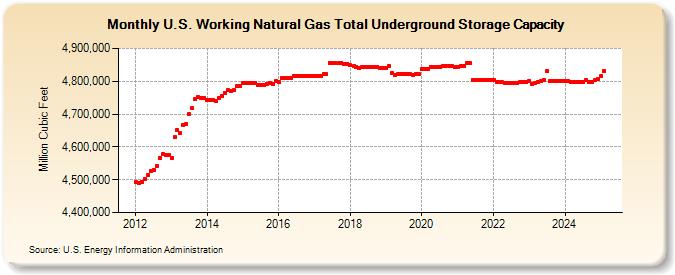
| U.S. Working Natural Gas Total Underground Storage Capacity (Million Cubic Feet) | ||||||||
| Year | Jan | Feb | Mar | Apr | May | Jun | Jul | Aug | Sep | Oct | Nov | Dec |
|---|---|---|---|---|---|---|---|---|---|---|---|---|
| 2012 | 4,491,557 | 4,491,226 | 4,491,596 | 4,502,901 | 4,514,569 | 4,526,987 | 4,530,486 | 4,540,575 | 4,567,586 | 4,577,649 | 4,575,112 | 4,576,356 |
| 2013 | 4,567,566 | 4,628,787 | 4,652,018 | 4,640,880 | 4,665,310 | 4,669,698 | 4,699,349 | 4,717,265 | 4,745,659 | 4,750,673 | 4,748,937 | 4,748,636 |
| 2014 | 4,743,198 | 4,741,378 | 4,741,585 | 4,740,958 | 4,749,560 | 4,755,665 | 4,764,979 | 4,771,870 | 4,770,241 | 4,772,138 | 4,784,895 | 4,785,669 |
| 2015 | 4,795,497 | 4,794,695 | 4,794,425 | 4,794,612 | 4,794,656 | 4,789,503 | 4,788,834 | 4,788,724 | 4,791,468 | 4,793,806 | 4,792,472 | 4,800,671 |
| 2016 | 4,798,652 | 4,808,712 | 4,809,185 | 4,809,595 | 4,811,085 | 4,815,694 | 4,814,915 | 4,814,913 | 4,816,889 | 4,816,583 | 4,816,580 | 4,815,970 |
| 2017 | 4,815,324 | 4,815,322 | 4,815,302 | 4,821,502 | 4,821,500 | 4,856,001 | 4,855,722 | 4,855,521 | 4,855,155 | 4,856,996 | 4,853,632 | 4,853,796 |
| 2018 | 4,848,347 | 4,845,885 | 4,843,595 | 4,839,475 | 4,843,641 | 4,843,638 | 4,843,638 | 4,843,632 | 4,843,633 | 4,843,640 | 4,840,591 | 4,840,158 |
| 2019 | 4,840,238 | 4,845,619 | 4,824,018 | 4,818,870 | 4,821,403 | 4,820,687 | 4,820,605 | 4,820,605 | 4,820,552 | 4,820,434 | 4,820,524 | 4,820,564 |
| 2020 | 4,838,021 | 4,837,995 | 4,836,851 | 4,842,811 | 4,842,784 | 4,842,757 | 4,842,725 | 4,845,046 | 4,845,020 | 4,844,988 | 4,845,169 | 4,842,398 |
| 2021 | 4,844,532 | 4,846,415 | 4,846,391 | 4,854,895 | 4,854,869 | 4,803,744 | 4,803,718 | 4,803,691 | 4,804,270 | 4,805,059 | 4,805,222 | 4,804,849 |
| 2022 | 4,803,852 | 4,796,847 | 4,796,847 | 4,796,684 | 4,794,730 | 4,795,844 | 4,795,817 | 4,795,791 | 4,795,952 | 4,796,338 | 4,796,607 | 4,796,613 |
| 2023 | 4,801,827 | 4,790,060 | 4,795,790 | 4,798,737 | 4,800,074 | 4,802,656 | 4,830,317 | 4,801,196 | 4,801,169 | 4,800,750 | 4,800,721 | 4,800,735 |
| 2024 | 4,787,225 | 4,787,313 | 4,782,608 | 4,785,385 | 4,785,009 | 4,783,518 | 4,783,096 | 4,789,563 | 4,783,475 | 4,783,277 | 4,791,049 | 4,793,009 |
| 2025 | 4,800,541 | 4,816,515 | 4,814,802 | 4,814,633 | 4,814,607 | 4,815,108 | 4,827,679 | 4,818,646 | 4,818,716 | 4,818,530 | 4,819,020 | 4,818,959 |
| 2026 | 4,815,817 | 4,815,509 | 4,813,474 | 4,814,454 | ||||||||
| - = No Data Reported; -- = Not Applicable; NA = Not Available; W = Withheld to avoid disclosure of individual company data. |
| Release Date: 6/30/2026 |
| Next Release Date: 7/31/2026 |
Referring Pages: