|
Download Data (XLS File) |
|
||||||||
|
||||||||
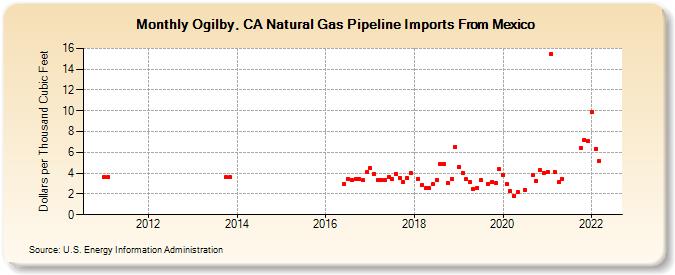
| Ogilby, CA Natural Gas Pipeline Imports From Mexico (Dollars per Thousand Cubic Feet) | ||||||||
| Year | Jan | Feb | Mar | Apr | May | Jun | Jul | Aug | Sep | Oct | Nov | Dec |
|---|---|---|---|---|---|---|---|---|---|---|---|---|
| 2011 | 3.63 | 3.65 | ||||||||||
| 2013 | 3.59 | 3.59 | ||||||||||
| 2016 | 2.93 | 3.45 | 3.36 | 3.42 | 3.42 | 3.30 | 4.08 | |||||
| 2017 | 4.49 | 3.92 | 3.34 | 3.35 | 3.34 | 3.59 | 3.47 | 3.95 | 3.50 | 3.17 | 3.49 | 4.00 |
| 2018 | 3.48 | 2.88 | 2.55 | 2.54 | 2.91 | 3.32 | 4.89 | 4.89 | 3.05 | 3.42 | 6.55 | |
| 2019 | 4.63 | 4.02 | 3.41 | 3.17 | 2.44 | 2.58 | 3.30 | 3.00 | 3.16 | 3.04 | 4.38 | |
| 2020 | 3.80 | 2.97 | 2.25 | 1.81 | 2.18 | 2.41 | 3.78 | 3.29 | 4.27 | 4.01 | ||
| 2021 | 4.11 | 15.49 | 4.10 | 3.12 | 3.46 | 6.41 | 7.20 | 7.08 | ||||
| 2022 | 9.91 | 6.35 | 5.17 | |||||||||
| - = No Data Reported; -- = Not Applicable; NA = Not Available; W = Withheld to avoid disclosure of individual company data. |
| Release Date: 6/30/2026 |
| Next Release Date: 7/31/2026 |