|
Download Data (XLS File) |
|
||||||||
|
||||||||
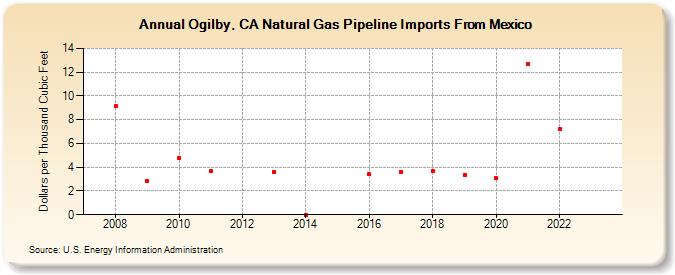
| Ogilby, CA Natural Gas Pipeline Imports From Mexico (Dollars per Thousand Cubic Feet) | ||||||||
| Decade | Year-0 | Year-1 | Year-2 | Year-3 | Year-4 | Year-5 | Year-6 | Year-7 | Year-8 | Year-9 |
|---|---|---|---|---|---|---|---|---|---|---|
| 2000's | -- | 9.15 | 2.83 | |||||||
| 2010's | 4.76 | 3.65 | -- | 3.59 | -- | -- | 3.39 | 3.61 | 3.65 | 3.37 |
| 2020's | 3.06 | 12.68 | 7.22 | -- | -- |
| - = No Data Reported; -- = Not Applicable; NA = Not Available; W = Withheld to avoid disclosure of individual company data. |
| Release Date: 6/30/2026 |
| Next Release Date: 7/31/2026 |