|
Download Data (XLS File) |
|
||||||||
|
||||||||
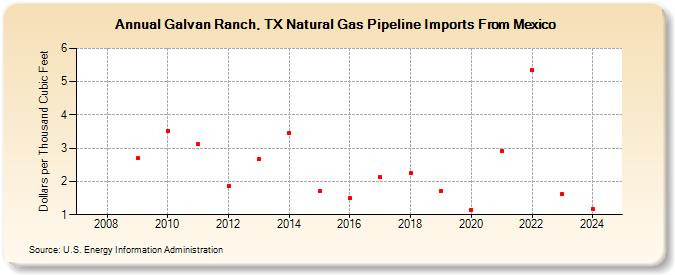
| Galvan Ranch, TX Natural Gas Pipeline Imports From Mexico (Dollars per Thousand Cubic Feet) | ||||||||
| Decade | Year-0 | Year-1 | Year-2 | Year-3 | Year-4 | Year-5 | Year-6 | Year-7 | Year-8 | Year-9 |
|---|---|---|---|---|---|---|---|---|---|---|
| 2000's | -- | -- | 2.69 | |||||||
| 2010's | 3.52 | 3.12 | 1.87 | 2.66 | 3.45 | 1.71 | 1.50 | 2.12 | 2.24 | 1.70 |
| 2020's | 1.15 | 2.93 | 5.35 | 1.62 | 1.18 | 2.13 |
| - = No Data Reported; -- = Not Applicable; NA = Not Available; W = Withheld to avoid disclosure of individual company data. |
| Release Date: 6/30/2026 |
| Next Release Date: 7/31/2026 |