|
Download Data (XLS File) |
|
||||||||
|
||||||||
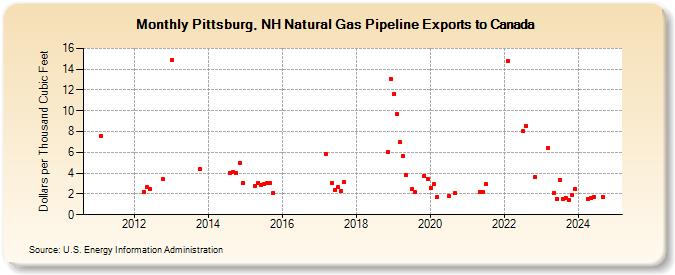
| Pittsburg, NH Natural Gas Pipeline Exports to Canada (Dollars per Thousand Cubic Feet) | ||||||||
| Year | Jan | Feb | Mar | Apr | May | Jun | Jul | Aug | Sep | Oct | Nov | Dec |
|---|---|---|---|---|---|---|---|---|---|---|---|---|
| 2011 | 7.54 | |||||||||||
| 2012 | 2.20 | 2.65 | 2.46 | 3.48 | ||||||||
| 2013 | 14.87 | 4.39 | ||||||||||
| 2014 | 4.06 | 4.09 | 4.01 | 5.00 | 3.08 | |||||||
| 2015 | 2.81 | 3.05 | 2.90 | 2.95 | 3.03 | 3.09 | 2.09 | |||||
| 2017 | 5.86 | 3.06 | 2.35 | 2.64 | 2.30 | 3.11 | ||||||
| 2018 | 6.02 | 13.09 | ||||||||||
| 2019 | 11.62 | 9.71 | 6.96 | 5.69 | 3.84 | 2.49 | 2.16 | 3.76 | 3.46 | |||
| 2020 | 2.58 | 2.92 | 1.70 | 1.81 | 2.07 | |||||||
| 2021 | 2.22 | 2.18 | 2.94 | |||||||||
| 2022 | 14.83 | 8.06 | 8.57 | 3.59 | ||||||||
| 2023 | 6.38 | 2.10 | 1.55 | 3.36 | 1.48 | 1.59 | 1.41 | 1.87 | 2.43 | |||
| 2024 | 1.55 | 1.57 | 1.75 | 1.69 | ||||||||
| 2025 | 3.29 | 2.19 | 2.65 | 6.18 | 2.42 | 1.96 | 2.22 | |||||
| 2026 | 48.74 | 2.58 | ||||||||||
| - = No Data Reported; -- = Not Applicable; NA = Not Available; W = Withheld to avoid disclosure of individual company data. |
| Release Date: 6/30/2026 |
| Next Release Date: 7/31/2026 |