|
Download Data (XLS File) |
|
||||||||
|
||||||||
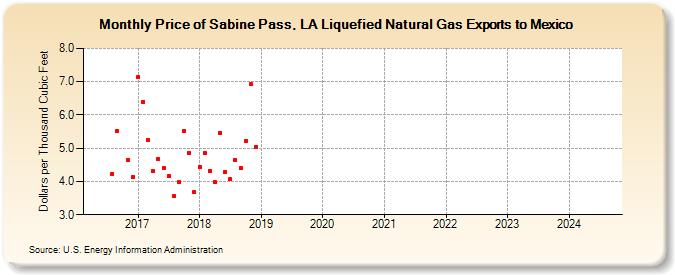
| Price of Sabine Pass, LA Liquefied Natural Gas Exports to Mexico (Dollars per Thousand Cubic Feet) | ||||||||
| Year | Jan | Feb | Mar | Apr | May | Jun | Jul | Aug | Sep | Oct | Nov | Dec |
|---|---|---|---|---|---|---|---|---|---|---|---|---|
| 2016 | 4.23 | 5.53 | 4.64 | 4.14 | ||||||||
| 2017 | 7.15 | 6.40 | 5.25 | 4.31 | 4.67 | 4.40 | 4.17 | 3.55 | 3.98 | 5.51 | 4.85 | 3.68 |
| 2018 | 4.43 | 4.85 | 4.32 | 3.98 | 5.47 | 4.27 | 4.06 | 4.65 | 4.40 | 5.22 | 6.92 | 5.04 |
| 2019 | W | W | W | W | W | W | W | W | W | W | W | |
| 2020 | W | W | W | W | W | W | ||||||
| 2021 | W | W | ||||||||||
| 2023 | 6.12 | 12.56 | ||||||||||
| 2024 | 3.97 | 5.05 | ||||||||||
| 2025 | W | |||||||||||
| - = No Data Reported; -- = Not Applicable; NA = Not Available; W = Withheld to avoid disclosure of individual company data. |
| Release Date: 6/30/2026 |
| Next Release Date: 7/31/2026 |