|
Download Data (XLS File) |
|
||||||||
|
||||||||
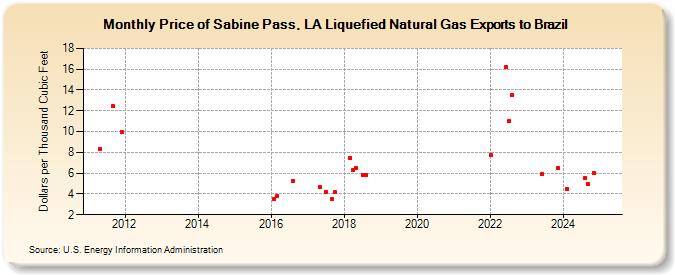
| Price of Sabine Pass, LA Liquefied Natural Gas Exports to Brazil (Dollars per Thousand Cubic Feet) | ||||||||
| Year | Jan | Feb | Mar | Apr | May | Jun | Jul | Aug | Sep | Oct | Nov | Dec |
|---|---|---|---|---|---|---|---|---|---|---|---|---|
| 2011 | 8.28 | 12.42 | 9.99 | |||||||||
| 2016 | 3.54 | 3.83 | 5.27 | |||||||||
| 2017 | 4.63 | 4.23 | 3.55 | 4.14 | ||||||||
| 2018 | 7.46 | 6.33 | 6.48 | 5.85 | 5.79 | |||||||
| 2019 | W | W | W | W | W | W | W | W | ||||
| 2020 | W | W | W | W | W | W | ||||||
| 2021 | W | W | W | W | W | W | W | W | W | W | W | W |
| 2022 | 7.72 | 16.19 | 10.98 | 13.50 | ||||||||
| 2023 | 5.72 | 5.93 | 6.17 | 6.49 | 6.51 | |||||||
| 2024 | 4.52 | 5.13 | 5.53 | 4.91 | 6.06 | 6.01 | ||||||
| 2025 | W | W | W | W | W | W | W | |||||
| 2026 | W | W | ||||||||||
| - = No Data Reported; -- = Not Applicable; NA = Not Available; W = Withheld to avoid disclosure of individual company data. |
| Release Date: 5/29/2026 |
| Next Release Date: 6/30/2026 |