|
Download Data (XLS File) |
|
||||||||
|
||||||||
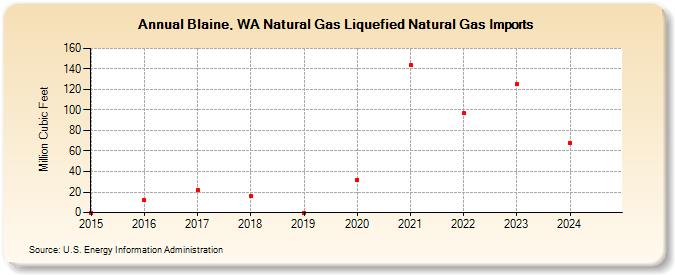
| Blaine, WA Natural Gas Liquefied Natural Gas Imports (Million Cubic Feet) | ||||||||
| Decade | Year-0 | Year-1 | Year-2 | Year-3 | Year-4 | Year-5 | Year-6 | Year-7 | Year-8 | Year-9 |
|---|---|---|---|---|---|---|---|---|---|---|
| 2010's | 0 | 12 | 22 | 16 | 0 | |||||
| 2020's | 32 | 144 | 97 | 125 | 68 | 29 |
| - = No Data Reported; -- = Not Applicable; NA = Not Available; W = Withheld to avoid disclosure of individual company data. |
| Release Date: 5/29/2026 |
| Next Release Date: 6/30/2026 |