|
Download Data (XLS File) |
|
||||||||
|
||||||||
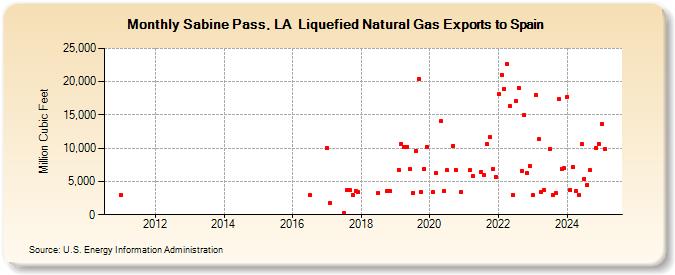
| Sabine Pass, LA Liquefied Natural Gas Exports to Spain (Million Cubic Feet) | ||||||||
| Year | Jan | Feb | Mar | Apr | May | Jun | Jul | Aug | Sep | Oct | Nov | Dec |
|---|---|---|---|---|---|---|---|---|---|---|---|---|
| 2011 | 3,007 | |||||||||||
| 2016 | 2,930 | |||||||||||
| 2017 | 10,002 | 1,766 | 217 | 3,712 | 3,666 | 2,980 | 3,617 | 3,370 | ||||
| 2018 | 3,230 | 3,551 | 3,529 | |||||||||
| 2019 | 6,748 | 10,678 | 10,139 | 10,191 | 6,842 | 3,297 | 9,598 | 20,395 | 3,413 | 6,937 | 10,239 | |
| 2020 | 3,387 | 6,205 | 14,018 | 3,570 | 6,654 | 10,366 | 6,738 | 3,391 | ||||
| 2021 | 6,659 | 5,861 | 6,447 | 5,916 | 10,628 | 11,705 | 6,892 | 5,720 | ||||
| 2022 | 18,138 | 21,045 | 18,897 | 22,585 | 16,320 | 2,934 | 17,118 | 19,113 | 6,622 | 14,965 | 6,217 | 7,317 |
| 2023 | 2,936 | 17,943 | 11,342 | 3,398 | 3,684 | 9,899 | 2,941 | 3,236 | 17,386 | 6,906 | 6,978 | |
| 2024 | 17,715 | 3,681 | 7,166 | 3,544 | 2,933 | 10,634 | 5,438 | 4,520 | 6,683 | 10,066 | 10,667 | |
| 2025 | 13,660 | 9,829 | 10,842 | 21,470 | 3,747 | 17,119 | 13,092 | 13,421 | 13,884 | 6,664 | 10,849 | |
| 2026 | 6,932 | 7,021 | 10,657 | 3,686 | ||||||||
| - = No Data Reported; -- = Not Applicable; NA = Not Available; W = Withheld to avoid disclosure of individual company data. |
| Release Date: 6/30/2026 |
| Next Release Date: 7/31/2026 |