|
Download Data (XLS File) |
|
||||||||
|
||||||||
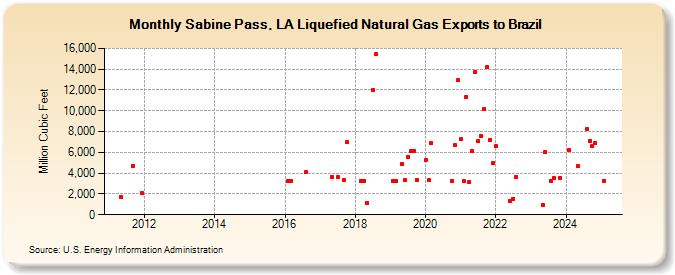
| Sabine Pass, LA Liquefied Natural Gas Exports to Brazil (Million Cubic Feet) | ||||||||
| Year | Jan | Feb | Mar | Apr | May | Jun | Jul | Aug | Sep | Oct | Nov | Dec |
|---|---|---|---|---|---|---|---|---|---|---|---|---|
| 2011 | 1,680 | 4,681 | 2,108 | |||||||||
| 2016 | 3,284 | 3,270 | 4,075 | |||||||||
| 2017 | 3,676 | 3,642 | 3,364 | 6,967 | ||||||||
| 2018 | 3,272 | 3,255 | 1,153 | 12,007 | 15,425 | |||||||
| 2019 | 3,234 | 3,283 | 4,905 | 3,313 | 5,579 | 6,101 | 6,117 | 3,345 | ||||
| 2020 | 5,225 | 3,305 | 6,891 | 3,288 | 6,671 | 12,922 | ||||||
| 2021 | 7,258 | 3,274 | 11,357 | 3,154 | 6,096 | 13,764 | 7,090 | 7,580 | 10,167 | 14,164 | 7,199 | 4,937 |
| 2022 | 6,569 | 1,316 | 1,538 | 3,661 | ||||||||
| 2023 | 919 | 6,032 | 3,287 | 3,528 | 3,563 | |||||||
| 2024 | 6,180 | 4,673 | 8,234 | 7,112 | 6,568 | 6,889 | ||||||
| 2025 | 3,290 | 3,287 | 3,283 | 3,389 | 3,284 | 6,381 | 3,285 | |||||
| 2026 | 3,290 | 3,420 | ||||||||||
| - = No Data Reported; -- = Not Applicable; NA = Not Available; W = Withheld to avoid disclosure of individual company data. |
| Release Date: 6/30/2026 |
| Next Release Date: 7/31/2026 |