|
Download Data (XLS File) |
|
||||||||
|
||||||||
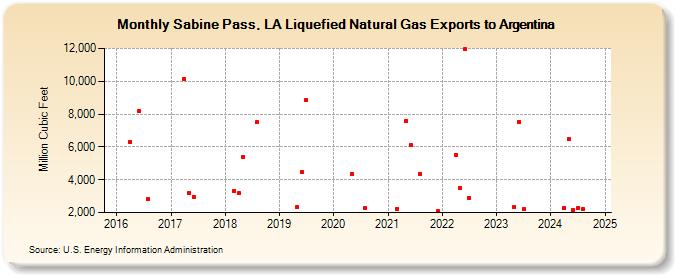
| Sabine Pass, LA Liquefied Natural Gas Exports to Argentina (Million Cubic Feet) | ||||||||
| Year | Jan | Feb | Mar | Apr | May | Jun | Jul | Aug | Sep | Oct | Nov | Dec |
|---|---|---|---|---|---|---|---|---|---|---|---|---|
| 2016 | 6,310 | 8,161 | 2,802 | |||||||||
| 2017 | 10,135 | 3,192 | 2,949 | |||||||||
| 2018 | 3,333 | 3,195 | 5,392 | 7,494 | ||||||||
| 2019 | 2,315 | 4,459 | 8,830 | |||||||||
| 2020 | 4,363 | 2,249 | ||||||||||
| 2021 | 2,238 | 7,589 | 6,114 | 4,335 | 2,077 | |||||||
| 2022 | 5,513 | 3,509 | 11,943 | 2,879 | ||||||||
| 2023 | 2,369 | 7,524 | 2,199 | |||||||||
| 2024 | 2,274 | 6,473 | 2,170 | 2,271 | 2,211 | |||||||
| 2025 | 2,124 | 2,139 | ||||||||||
| - = No Data Reported; -- = Not Applicable; NA = Not Available; W = Withheld to avoid disclosure of individual company data. |
| Release Date: 6/30/2026 |
| Next Release Date: 7/31/2026 |