|
Download Data (XLS File) |
|
||||||||
|
||||||||
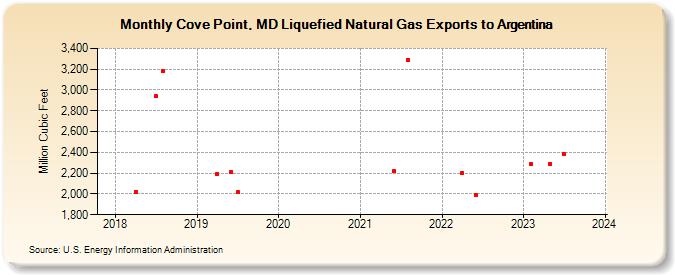
| Cove Point, MD Liquefied Natural Gas Exports to Argentina (Million Cubic Feet) | ||||||||
| Year | Jan | Feb | Mar | Apr | May | Jun | Jul | Aug | Sep | Oct | Nov | Dec |
|---|---|---|---|---|---|---|---|---|---|---|---|---|
| 2018 | 2,023 | 2,939 | 3,185 | |||||||||
| 2019 | 2,194 | 2,213 | 2,014 | |||||||||
| 2021 | 2,219 | 3,292 | ||||||||||
| 2022 | 2,201 | 1,990 | ||||||||||
| 2023 | 2,287 | 2,291 | 2,385 | |||||||||
| 2024 | 1,446 | 2,059 | ||||||||||
| - = No Data Reported; -- = Not Applicable; NA = Not Available; W = Withheld to avoid disclosure of individual company data. |
| Release Date: 6/30/2026 |
| Next Release Date: 7/31/2026 |