|
Download Data (XLS File) |
|
|||||
|
|||||
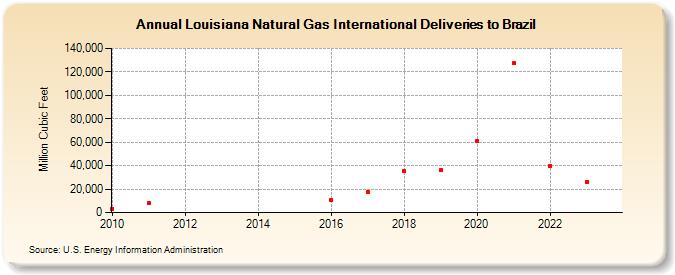
| Louisiana Natural Gas International Deliveries to Brazil (Million Cubic Feet) | |||||
| Decade | Year-0 | Year-1 | Year-2 | Year-3 | Year-4 | Year-5 | Year-6 | Year-7 | Year-8 | Year-9 |
|---|---|---|---|---|---|---|---|---|---|---|
| 2010's | 3,279 | 8,468 | 10,629 | 17,648 | 35,112 | 35,877 | ||||
| 2020's | 61,092 | 127,296 | 39,823 | 26,235 | 61,739 |
| - = No Data Reported; -- = Not Applicable; NA = Not Available; W = Withheld to avoid disclosure of individual company data. |
| Release Date: 6/30/2026 |
| Next Release Date: 7/31/2026 |