|
Download Data (XLS File) |
|
|||||
|
|||||
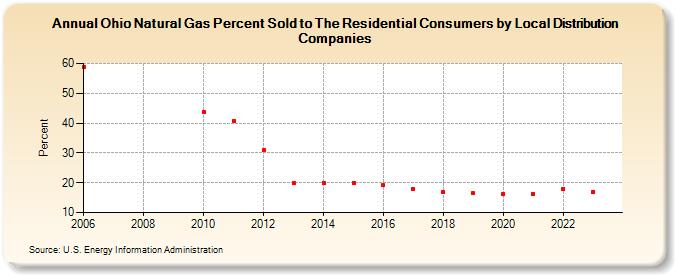
| Ohio Natural Gas Percent Sold to The Residential Consumers by Local Distribution Companies (Percent) | |||||
| Decade | Year-0 | Year-1 | Year-2 | Year-3 | Year-4 | Year-5 | Year-6 | Year-7 | Year-8 | Year-9 |
|---|---|---|---|---|---|---|---|---|---|---|
| 2000's | 58.77 | |||||||||
| 2010's | 43.70 | 40.82 | 30.88 | 19.79 | 20.02 | 20.07 | 19.12 | 17.74 | 16.81 | 16.46 |
| 2020's | 16.27 | 16.38 | 18.03 | 17.02 | 15.90 |
| - = No Data Reported; -- = Not Applicable; NA = Not Available; W = Withheld to avoid disclosure of individual company data. |
| Release Date: 6/30/2026 |
| Next Release Date: 7/31/2026 |