|
Download Data (XLS File) |
|
|||||
|
|||||
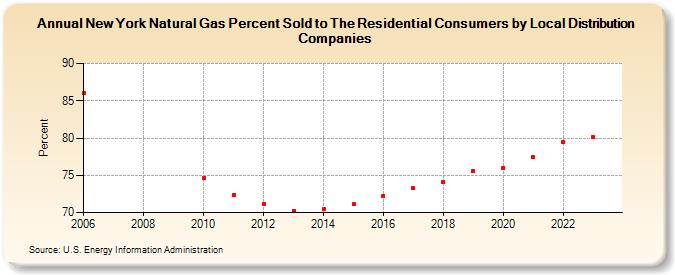
| New York Natural Gas Percent Sold to The Residential Consumers by Local Distribution Companies (Percent) | |||||
| Decade | Year-0 | Year-1 | Year-2 | Year-3 | Year-4 | Year-5 | Year-6 | Year-7 | Year-8 | Year-9 |
|---|---|---|---|---|---|---|---|---|---|---|
| 2000's | 86.06 | |||||||||
| 2010's | 74.61 | 72.41 | 71.20 | 70.27 | 70.50 | 71.09 | 72.26 | 73.24 | 74.10 | 75.60 |
| 2020's | 76.03 | 77.43 | 79.53 | 80.09 | 80.67 |
| - = No Data Reported; -- = Not Applicable; NA = Not Available; W = Withheld to avoid disclosure of individual company data. |
| Release Date: 6/30/2026 |
| Next Release Date: 7/31/2026 |