|
Download Data (XLS File) |
|
|||||
|
|||||
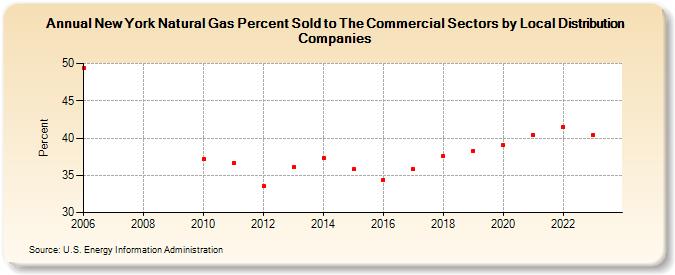
| New York Natural Gas Percent Sold to The Commercial Sectors by Local Distribution Companies (Percent) | |||||
| Decade | Year-0 | Year-1 | Year-2 | Year-3 | Year-4 | Year-5 | Year-6 | Year-7 | Year-8 | Year-9 |
|---|---|---|---|---|---|---|---|---|---|---|
| 2000's | 49.39 | |||||||||
| 2010's | 37.17 | 36.71 | 33.60 | 36.10 | 37.29 | 35.79 | 34.43 | 35.80 | 37.55 | 38.31 |
| 2020's | 39.05 | 40.46 | 41.52 | 40.22 | 32.81 |
| - = No Data Reported; -- = Not Applicable; NA = Not Available; W = Withheld to avoid disclosure of individual company data. |
| Release Date: 6/30/2026 |
| Next Release Date: 7/31/2026 |