|
Download Data (XLS File) |
|
|||||
|
|||||
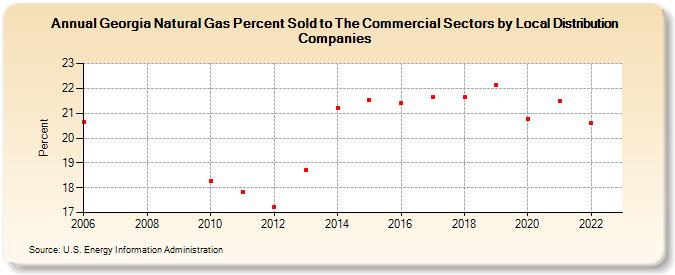
| Georgia Natural Gas Percent Sold to The Commercial Sectors by Local Distribution Companies (Percent) | |||||
| Decade | Year-0 | Year-1 | Year-2 | Year-3 | Year-4 | Year-5 | Year-6 | Year-7 | Year-8 | Year-9 |
|---|---|---|---|---|---|---|---|---|---|---|
| 2000's | 20.63 | |||||||||
| 2010's | 18.28 | 17.83 | 17.23 | 18.71 | 21.21 | 21.52 | 21.39 | 21.66 | 21.65 | 22.15 |
| 2020's | 20.78 | 21.50 | 21.23 | 22.78 | 22.26 |
| - = No Data Reported; -- = Not Applicable; NA = Not Available; W = Withheld to avoid disclosure of individual company data. |
| Release Date: 6/30/2026 |
| Next Release Date: 7/31/2026 |