|
Download Data (XLS File) |
|
||||||||
|
||||||||
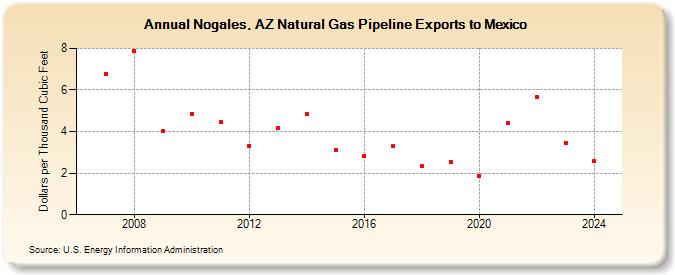
| Nogales, AZ Natural Gas Pipeline Exports to Mexico (Dollars per Thousand Cubic Feet) | ||||||||
| Decade | Year-0 | Year-1 | Year-2 | Year-3 | Year-4 | Year-5 | Year-6 | Year-7 | Year-8 | Year-9 |
|---|---|---|---|---|---|---|---|---|---|---|
| 2000's | -- | 6.79 | 7.88 | 4.04 | ||||||
| 2010's | 4.86 | 4.47 | 3.31 | 4.15 | 4.83 | 3.09 | 2.83 | 3.29 | 2.32 | 2.54 |
| 2020's | 1.88 | 4.42 | 5.66 | 3.47 | 2.58 | 2.91 |
| - = No Data Reported; -- = Not Applicable; NA = Not Available; W = Withheld to avoid disclosure of individual company data. |
| Release Date: 6/30/2026 |
| Next Release Date: 7/31/2026 |