|
Download Data (XLS File) |
|
||||||||
|
||||||||
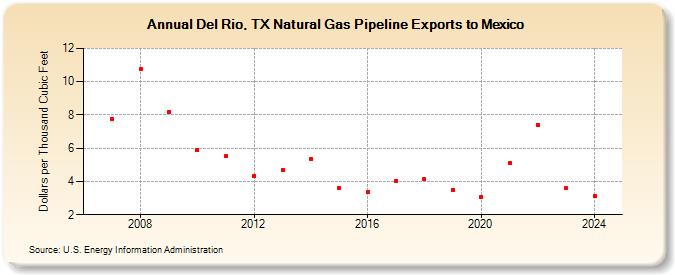
| Del Rio, TX Natural Gas Pipeline Exports to Mexico (Dollars per Thousand Cubic Feet) | ||||||||
| Decade | Year-0 | Year-1 | Year-2 | Year-3 | Year-4 | Year-5 | Year-6 | Year-7 | Year-8 | Year-9 |
|---|---|---|---|---|---|---|---|---|---|---|
| 2000's | -- | 7.74 | 10.76 | 8.20 | ||||||
| 2010's | 5.92 | 5.53 | 4.33 | 4.69 | 5.35 | 3.59 | 3.37 | 4.03 | 4.13 | 3.51 |
| 2020's | 3.05 | 5.11 | 7.42 | 3.58 | 3.12 | 4.18 |
| - = No Data Reported; -- = Not Applicable; NA = Not Available; W = Withheld to avoid disclosure of individual company data. |
| Release Date: 6/30/2026 |
| Next Release Date: 7/31/2026 |