|
Download Data (XLS File) |
|
||||||||
|
||||||||
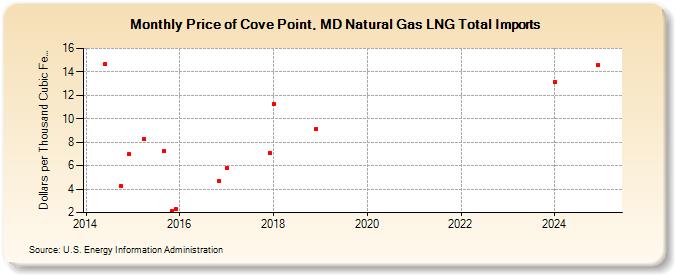
| Price of Cove Point, MD Natural Gas LNG Total Imports (Dollars per Thousand Cubic Feet) | ||||||||
| Year | Jan | Feb | Mar | Apr | May | Jun | Jul | Aug | Sep | Oct | Nov | Dec |
|---|---|---|---|---|---|---|---|---|---|---|---|---|
| 2014 | 14.66 | 4.30 | 6.96 | |||||||||
| 2015 | 8.29 | 7.24 | 2.13 | 2.31 | ||||||||
| 2016 | 4.66 | |||||||||||
| 2017 | 5.82 | 7.11 | ||||||||||
| 2018 | 11.30 | 9.15 | ||||||||||
| 2019 | W | |||||||||||
| 2020 | W | W | W | W | W | |||||||
| 2024 | 13.14 | 14.61 | ||||||||||
| 2025 | 13.24 | |||||||||||
| 2026 | 26.29 | |||||||||||
| - = No Data Reported; -- = Not Applicable; NA = Not Available; W = Withheld to avoid disclosure of individual company data. |
| Release Date: 6/30/2026 |
| Next Release Date: 7/31/2026 |