|
Download Data (XLS File) |
|
||||||||
|
||||||||
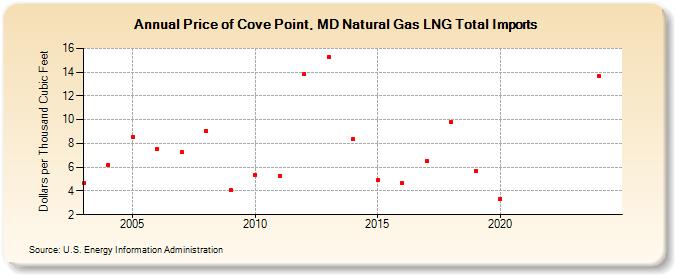
| Price of Cove Point, MD Natural Gas LNG Total Imports (Dollars per Thousand Cubic Feet) | ||||||||
| Decade | Year-0 | Year-1 | Year-2 | Year-3 | Year-4 | Year-5 | Year-6 | Year-7 | Year-8 | Year-9 |
|---|---|---|---|---|---|---|---|---|---|---|
| 2000's | 4.69 | 6.21 | 8.57 | 7.51 | 7.26 | 9.07 | 4.05 | |||
| 2010's | 5.37 | 5.30 | 13.82 | 15.29 | 8.34 | 4.91 | 4.66 | 6.52 | 9.82 | 5.71 |
| 2020's | 3.35 | -- | -- | -- | 13.66 | 13.24 |
| - = No Data Reported; -- = Not Applicable; NA = Not Available; W = Withheld to avoid disclosure of individual company data. |
| Release Date: 6/30/2026 |
| Next Release Date: 7/31/2026 |