|
Download Data (XLS File) |
|
|||||
|
|||||
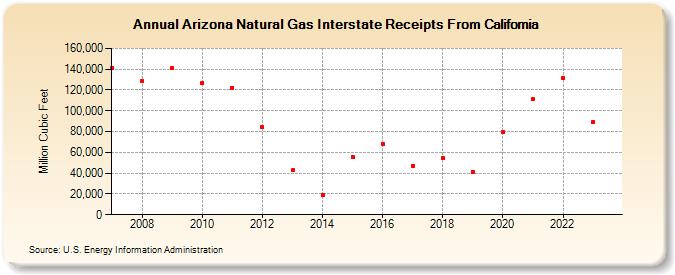
| Arizona Natural Gas Interstate Receipts From California (Million Cubic Feet) | |||||
| Decade | Year-0 | Year-1 | Year-2 | Year-3 | Year-4 | Year-5 | Year-6 | Year-7 | Year-8 | Year-9 |
|---|---|---|---|---|---|---|---|---|---|---|
| 2000's | 141,456 | 128,813 | 140,881 | |||||||
| 2010's | 126,566 | 122,198 | 83,992 | 42,609 | 19,434 | 55,631 | 68,441 | 47,331 | 54,946 | 41,551 |
| 2020's | 79,476 | 111,177 | 131,616 | 89,188 | 81,121 |
| - = No Data Reported; -- = Not Applicable; NA = Not Available; W = Withheld to avoid disclosure of individual company data. |
| Release Date: 6/30/2026 |
| Next Release Date: 7/31/2026 |