|
Download Data (XLS File) |
|
|||||
|
|||||
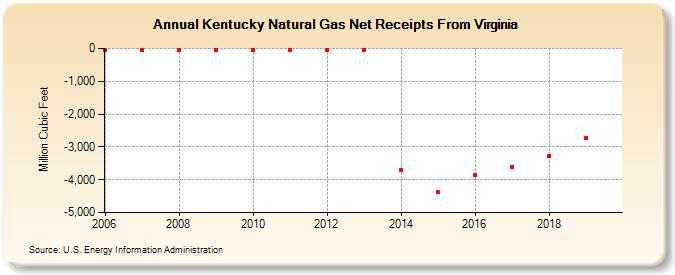
| Kentucky Natural Gas Net Receipts From Virginia (Million Cubic Feet) | |||||
| Decade | Year-0 | Year-1 | Year-2 | Year-3 | Year-4 | Year-5 | Year-6 | Year-7 | Year-8 | Year-9 |
|---|---|---|---|---|---|---|---|---|---|---|
| 2000's | -56 | -54 | -57 | -48 | ||||||
| 2010's | -44 | -41 | -44 | -48 | -3,706 | -4,364 | -3,867 | -3,618 | -3,275 | -2,734 |
| - = No Data Reported; -- = Not Applicable; NA = Not Available; W = Withheld to avoid disclosure of individual company data. |
| Release Date: 6/30/2026 |
| Next Release Date: 7/31/2026 |