|
Download Data (XLS File) |
|
||||||||
|
||||||||
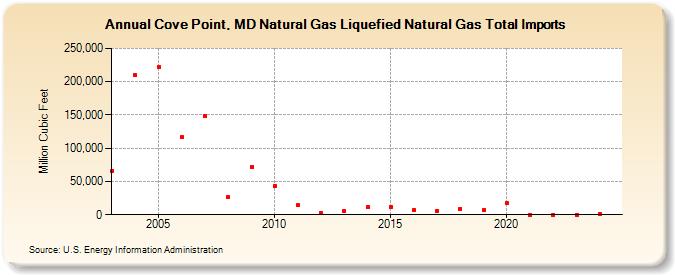
| Cove Point, MD Natural Gas Liquefied Natural Gas Total Imports (Million Cubic Feet) | ||||||||
| Decade | Year-0 | Year-1 | Year-2 | Year-3 | Year-4 | Year-5 | Year-6 | Year-7 | Year-8 | Year-9 |
|---|---|---|---|---|---|---|---|---|---|---|
| 2000's | 66,078 | 209,294 | 221,689 | 116,613 | 148,231 | 25,894 | 72,339 | |||
| 2010's | 43,431 | 13,981 | 2,790 | 5,366 | 11,585 | 12,091 | 6,505 | 5,992 | 9,070 | 6,703 |
| 2020's | 17,081 | 0 | 0 | 0 | 1,493 | 1,156 |
| - = No Data Reported; -- = Not Applicable; NA = Not Available; W = Withheld to avoid disclosure of individual company data. |
| Release Date: 6/30/2026 |
| Next Release Date: 7/31/2026 |