|
Download Data (XLS File) |
|
|||||
|
|||||
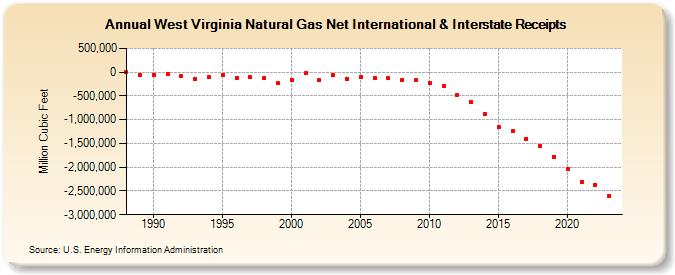
| West Virginia Natural Gas Net International & Interstate Receipts (Million Cubic Feet) | |||||
| Decade | Year-0 | Year-1 | Year-2 | Year-3 | Year-4 | Year-5 | Year-6 | Year-7 | Year-8 | Year-9 |
|---|---|---|---|---|---|---|---|---|---|---|
| 1980's | 0 | -59,222 | ||||||||
| 1990's | -50,709 | -32,339 | -76,901 | -138,967 | -105,063 | -53,057 | -122,393 | -100,347 | -132,917 | -236,588 |
| 2000's | -154,652 | -14,138 | -166,432 | -60,639 | -134,477 | -106,393 | -119,235 | -130,800 | -163,631 | -175,395 |
| 2010's | -227,302 | -281,289 | -475,605 | -618,278 | -874,813 | -1,159,080 | -1,243,532 | -1,398,412 | -1,546,327 | -1,776,646 |
| 2020's | -2,048,066 | -2,302,202 | -2,369,178 | -2,607,785 | -2,573,418 |
| - = No Data Reported; -- = Not Applicable; NA = Not Available; W = Withheld to avoid disclosure of individual company data. |
| Release Date: 6/30/2026 |
| Next Release Date: 7/31/2026 |