|
Download Data (XLS File) |
|
|||||
|
|||||
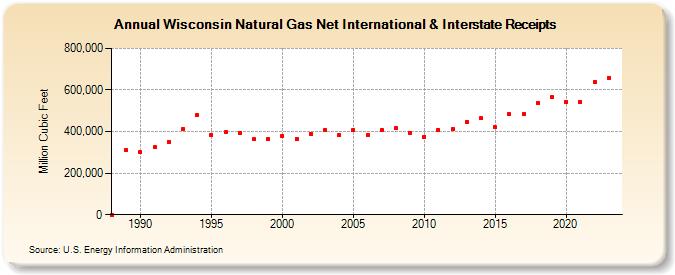
| Wisconsin Natural Gas Net International & Interstate Receipts (Million Cubic Feet) | |||||
| Decade | Year-0 | Year-1 | Year-2 | Year-3 | Year-4 | Year-5 | Year-6 | Year-7 | Year-8 | Year-9 |
|---|---|---|---|---|---|---|---|---|---|---|
| 1980's | 0 | 310,528 | ||||||||
| 1990's | 299,606 | 323,441 | 351,672 | 412,892 | 480,425 | 383,496 | 397,714 | 393,058 | 362,128 | 365,058 |
| 2000's | 379,900 | 364,329 | 390,164 | 407,112 | 381,113 | 408,021 | 382,734 | 407,218 | 415,491 | 395,034 |
| 2010's | 375,753 | 406,644 | 411,653 | 447,850 | 463,175 | 419,774 | 482,558 | 484,090 | 538,846 | 564,406 |
| 2020's | 543,638 | 544,352 | 640,647 | 659,376 | 595,695 |
| - = No Data Reported; -- = Not Applicable; NA = Not Available; W = Withheld to avoid disclosure of individual company data. |
| Release Date: 6/30/2026 |
| Next Release Date: 7/31/2026 |