|
Download Data (XLS File) |
|
|||||
|
|||||
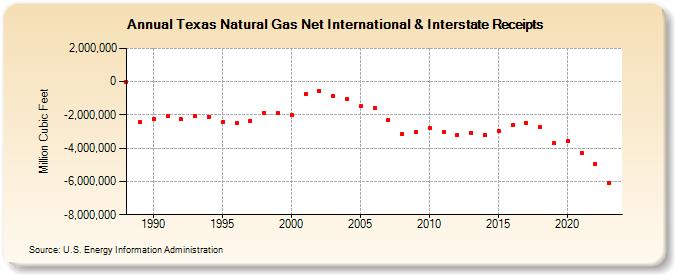
| Texas Natural Gas Net International & Interstate Receipts (Million Cubic Feet) | |||||
| Decade | Year-0 | Year-1 | Year-2 | Year-3 | Year-4 | Year-5 | Year-6 | Year-7 | Year-8 | Year-9 |
|---|---|---|---|---|---|---|---|---|---|---|
| 1980's | 0 | -2,406,546 | ||||||||
| 1990's | -2,243,726 | -2,091,178 | -2,274,705 | -2,068,491 | -2,105,299 | -2,404,536 | -2,488,641 | -2,364,504 | -1,860,129 | -1,874,900 |
| 2000's | -1,992,391 | -735,137 | -568,559 | -859,389 | -1,054,071 | -1,483,543 | -1,603,509 | -2,275,810 | -3,153,129 | -3,024,761 |
| 2010's | -2,807,295 | -3,026,996 | -3,179,150 | -3,064,570 | -3,209,046 | -2,972,043 | -2,634,260 | -2,478,404 | -2,746,657 | -3,691,791 |
| 2020's | -3,571,887 | -4,285,316 | -4,940,024 | -6,069,587 | -6,498,093 |
| - = No Data Reported; -- = Not Applicable; NA = Not Available; W = Withheld to avoid disclosure of individual company data. |
| Release Date: 6/30/2026 |
| Next Release Date: 7/31/2026 |
Referring Pages: