|
Download Data (XLS File) |
|
|||||
|
|||||
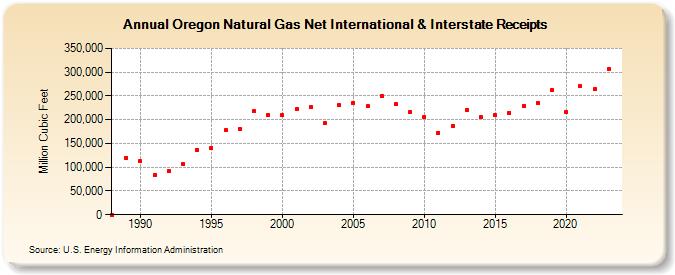
| Oregon Natural Gas Net International & Interstate Receipts (Million Cubic Feet) | |||||
| Decade | Year-0 | Year-1 | Year-2 | Year-3 | Year-4 | Year-5 | Year-6 | Year-7 | Year-8 | Year-9 |
|---|---|---|---|---|---|---|---|---|---|---|
| 1980's | 0 | 120,304 | ||||||||
| 1990's | 112,491 | 83,503 | 90,940 | 105,699 | 136,833 | 140,861 | 177,554 | 181,173 | 217,378 | 209,999 |
| 2000's | 209,003 | 221,614 | 226,054 | 192,971 | 229,826 | 236,074 | 228,508 | 250,051 | 232,094 | 216,609 |
| 2010's | 205,101 | 172,850 | 186,854 | 220,214 | 205,371 | 209,636 | 214,666 | 229,804 | 235,505 | 262,664 |
| 2020's | 215,866 | 270,302 | 263,553 | 305,873 | 291,422 |
| - = No Data Reported; -- = Not Applicable; NA = Not Available; W = Withheld to avoid disclosure of individual company data. |
| Release Date: 6/30/2026 |
| Next Release Date: 7/31/2026 |