|
Download Data (XLS File) |
|
|||||
|
|||||
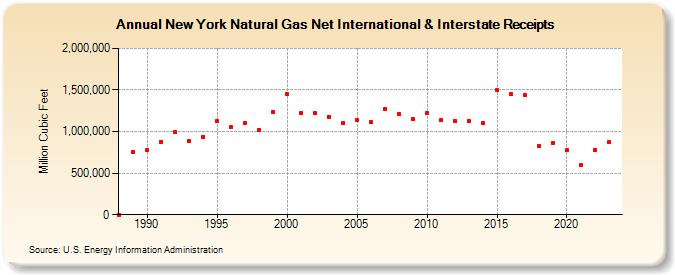
| New York Natural Gas Net International & Interstate Receipts (Million Cubic Feet) | |||||
| Decade | Year-0 | Year-1 | Year-2 | Year-3 | Year-4 | Year-5 | Year-6 | Year-7 | Year-8 | Year-9 |
|---|---|---|---|---|---|---|---|---|---|---|
| 1980's | 0 | 758,925 | ||||||||
| 1990's | 777,122 | 879,357 | 996,803 | 888,937 | 939,132 | 1,120,946 | 1,048,760 | 1,106,411 | 1,021,660 | 1,238,255 |
| 2000's | 1,448,952 | 1,225,406 | 1,220,734 | 1,179,401 | 1,103,555 | 1,140,982 | 1,114,013 | 1,276,232 | 1,212,713 | 1,151,439 |
| 2010's | 1,224,575 | 1,133,954 | 1,123,061 | 1,122,337 | 1,096,954 | 1,501,773 | 1,454,516 | 1,440,986 | 822,430 | 867,344 |
| 2020's | 773,881 | 593,307 | 779,695 | 873,114 | 1,004,441 |
| - = No Data Reported; -- = Not Applicable; NA = Not Available; W = Withheld to avoid disclosure of individual company data. |
| Release Date: 6/30/2026 |
| Next Release Date: 7/31/2026 |