|
Download Data (XLS File) |
|
|||||
|
|||||
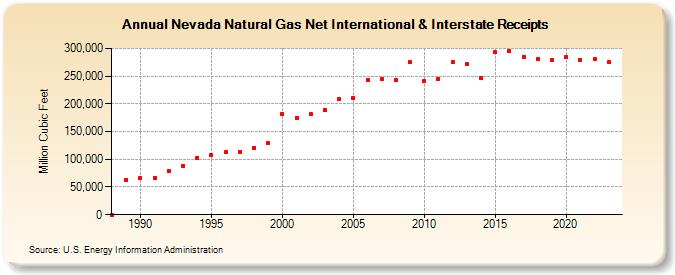
| Nevada Natural Gas Net International & Interstate Receipts (Million Cubic Feet) | |||||
| Decade | Year-0 | Year-1 | Year-2 | Year-3 | Year-4 | Year-5 | Year-6 | Year-7 | Year-8 | Year-9 |
|---|---|---|---|---|---|---|---|---|---|---|
| 1980's | 0 | 63,158 | ||||||||
| 1990's | 66,446 | 66,934 | 79,067 | 88,376 | 102,628 | 108,112 | 112,550 | 114,006 | 121,071 | 129,443 |
| 2000's | 181,872 | 174,986 | 180,811 | 189,240 | 208,992 | 211,254 | 243,357 | 245,609 | 242,982 | 274,883 |
| 2010's | 241,588 | 245,304 | 274,630 | 271,693 | 246,813 | 292,665 | 295,496 | 284,967 | 280,799 | 279,845 |
| 2020's | 285,211 | 279,671 | 280,857 | 274,728 | 274,121 |
| - = No Data Reported; -- = Not Applicable; NA = Not Available; W = Withheld to avoid disclosure of individual company data. |
| Release Date: 6/30/2026 |
| Next Release Date: 7/31/2026 |