|
Download Data (XLS File) |
|
|||||
|
|||||
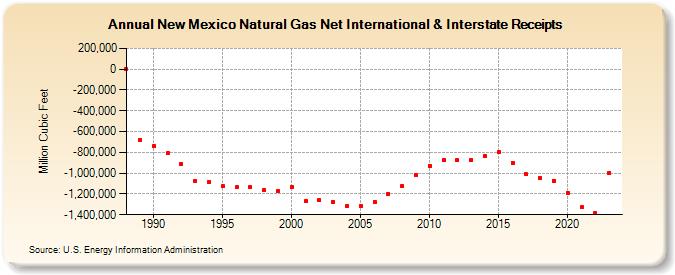
| New Mexico Natural Gas Net International & Interstate Receipts (Million Cubic Feet) | |||||
| Decade | Year-0 | Year-1 | Year-2 | Year-3 | Year-4 | Year-5 | Year-6 | Year-7 | Year-8 | Year-9 |
|---|---|---|---|---|---|---|---|---|---|---|
| 1980's | 0 | -677,445 | ||||||||
| 1990's | -738,821 | -810,260 | -911,733 | -1,073,957 | -1,082,958 | -1,127,337 | -1,136,212 | -1,137,763 | -1,166,885 | -1,173,095 |
| 2000's | -1,137,029 | -1,266,709 | -1,259,768 | -1,275,906 | -1,318,668 | -1,314,763 | -1,277,489 | -1,199,029 | -1,125,363 | -1,022,239 |
| 2010's | -928,622 | -875,172 | -876,477 | -870,434 | -835,958 | -795,502 | -899,204 | -1,011,953 | -1,043,382 | -1,072,751 |
| 2020's | -1,187,869 | -1,329,310 | -1,379,575 | -998,200 | -995,500 |
| - = No Data Reported; -- = Not Applicable; NA = Not Available; W = Withheld to avoid disclosure of individual company data. |
| Release Date: 6/30/2026 |
| Next Release Date: 7/31/2026 |