|
Download Data (XLS File) |
|
|||||
|
|||||
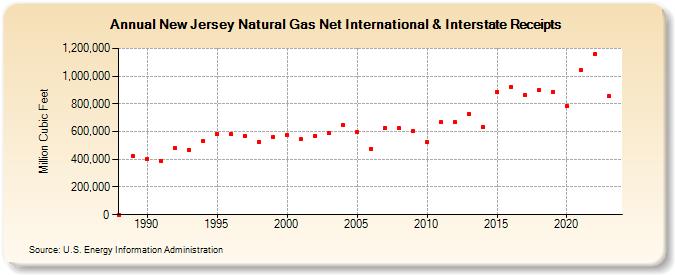
| New Jersey Natural Gas Net International & Interstate Receipts (Million Cubic Feet) | |||||
| Decade | Year-0 | Year-1 | Year-2 | Year-3 | Year-4 | Year-5 | Year-6 | Year-7 | Year-8 | Year-9 |
|---|---|---|---|---|---|---|---|---|---|---|
| 1980's | 0 | 424,475 | ||||||||
| 1990's | 405,382 | 386,642 | 480,627 | 466,047 | 530,317 | 584,045 | 580,023 | 567,479 | 524,708 | 564,195 |
| 2000's | 576,160 | 543,613 | 570,473 | 586,428 | 644,527 | 595,036 | 476,130 | 628,802 | 622,251 | 607,559 |
| 2010's | 523,386 | 665,404 | 667,704 | 725,217 | 632,755 | 885,519 | 924,012 | 864,226 | 896,902 | 886,803 |
| 2020's | 782,977 | 1,042,240 | 1,159,127 | 856,360 | 848,681 |
| - = No Data Reported; -- = Not Applicable; NA = Not Available; W = Withheld to avoid disclosure of individual company data. |
| Release Date: 6/30/2026 |
| Next Release Date: 7/31/2026 |