|
Download Data (XLS File) |
|
|||||
|
|||||
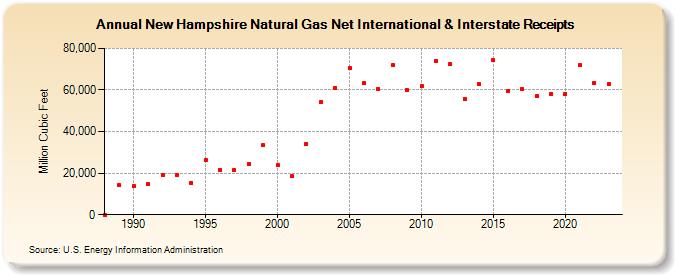
| New Hampshire Natural Gas Net International & Interstate Receipts (Million Cubic Feet) | |||||
| Decade | Year-0 | Year-1 | Year-2 | Year-3 | Year-4 | Year-5 | Year-6 | Year-7 | Year-8 | Year-9 |
|---|---|---|---|---|---|---|---|---|---|---|
| 1980's | 0 | 14,079 | ||||||||
| 1990's | 13,634 | 14,680 | 18,975 | 19,270 | 15,365 | 26,221 | 21,548 | 21,287 | 24,365 | 33,295 |
| 2000's | 23,715 | 18,472 | 34,135 | 54,128 | 61,176 | 70,678 | 63,274 | 60,387 | 71,895 | 59,780 |
| 2010's | 61,769 | 73,709 | 72,272 | 55,760 | 62,703 | 74,224 | 59,420 | 60,441 | 57,052 | 58,249 |
| 2020's | 58,268 | 71,894 | 63,390 | 62,730 | 59,856 |
| - = No Data Reported; -- = Not Applicable; NA = Not Available; W = Withheld to avoid disclosure of individual company data. |
| Release Date: 6/30/2026 |
| Next Release Date: 7/31/2026 |