|
Download Data (XLS File) |
|
|||||
|
|||||
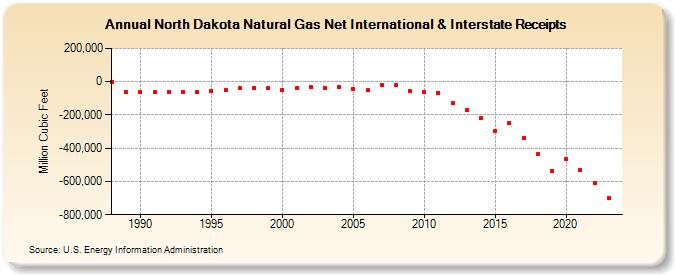
| North Dakota Natural Gas Net International & Interstate Receipts (Million Cubic Feet) | |||||
| Decade | Year-0 | Year-1 | Year-2 | Year-3 | Year-4 | Year-5 | Year-6 | Year-7 | Year-8 | Year-9 |
|---|---|---|---|---|---|---|---|---|---|---|
| 1980's | 0 | -64,474 | ||||||||
| 1990's | -64,687 | -59,695 | -62,738 | -63,545 | -61,969 | -57,025 | -49,536 | -38,897 | -39,490 | -39,787 |
| 2000's | -48,664 | -40,904 | -34,237 | -36,945 | -33,610 | -44,244 | -50,676 | -17,946 | -19,808 | -57,156 |
| 2010's | -63,494 | -67,896 | -131,016 | -172,512 | -218,593 | -298,290 | -246,920 | -339,245 | -435,346 | -534,314 |
| 2020's | -464,625 | -529,848 | -609,674 | -698,517 | -760,793 |
| - = No Data Reported; -- = Not Applicable; NA = Not Available; W = Withheld to avoid disclosure of individual company data. |
| Release Date: 6/30/2026 |
| Next Release Date: 7/31/2026 |