|
Download Data (XLS File) |
|
|||||
|
|||||
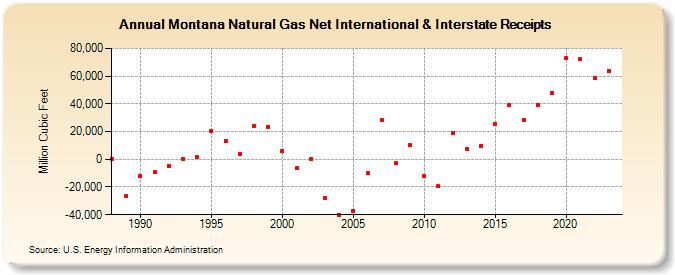
| Montana Natural Gas Net International & Interstate Receipts (Million Cubic Feet) | |||||
| Decade | Year-0 | Year-1 | Year-2 | Year-3 | Year-4 | Year-5 | Year-6 | Year-7 | Year-8 | Year-9 |
|---|---|---|---|---|---|---|---|---|---|---|
| 1980's | 0 | -26,785 | ||||||||
| 1990's | -12,066 | -9,254 | -4,557 | 280 | 1,517 | 20,751 | 13,394 | 4,108 | 24,315 | 23,108 |
| 2000's | 6,324 | -6,638 | -34 | -28,213 | -39,887 | -36,971 | -9,643 | 28,381 | -2,781 | 10,037 |
| 2010's | -12,064 | -19,625 | 18,970 | 7,310 | 9,575 | 25,776 | 38,848 | 28,339 | 39,477 | 47,858 |
| 2020's | 73,148 | 72,142 | 58,652 | 63,971 | 55,723 |
| - = No Data Reported; -- = Not Applicable; NA = Not Available; W = Withheld to avoid disclosure of individual company data. |
| Release Date: 6/30/2026 |
| Next Release Date: 7/31/2026 |