|
Download Data (XLS File) |
|
|||||
|
|||||
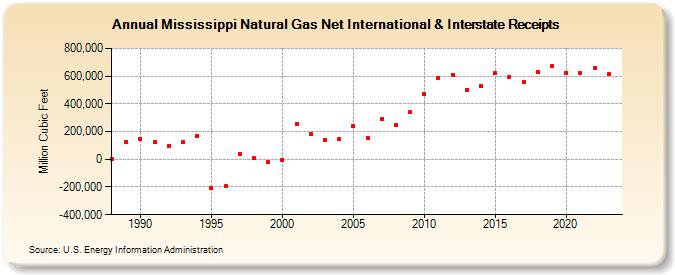
| Mississippi Natural Gas Net International & Interstate Receipts (Million Cubic Feet) | |||||
| Decade | Year-0 | Year-1 | Year-2 | Year-3 | Year-4 | Year-5 | Year-6 | Year-7 | Year-8 | Year-9 |
|---|---|---|---|---|---|---|---|---|---|---|
| 1980's | 0 | 127,719 | ||||||||
| 1990's | 144,773 | 123,852 | 95,107 | 122,689 | 167,621 | -209,220 | -193,358 | 40,809 | 11,621 | -18,588 |
| 2000's | -3,496 | 250,960 | 182,680 | 139,720 | 149,471 | 237,104 | 153,503 | 290,521 | 246,840 | 339,369 |
| 2010's | 468,302 | 589,436 | 610,006 | 500,756 | 529,400 | 620,191 | 596,590 | 559,915 | 632,084 | 672,635 |
| 2020's | 625,833 | 623,141 | 655,725 | 614,942 | 677,781 |
| - = No Data Reported; -- = Not Applicable; NA = Not Available; W = Withheld to avoid disclosure of individual company data. |
| Release Date: 6/30/2026 |
| Next Release Date: 7/31/2026 |