|
Download Data (XLS File) |
|
|||||
|
|||||
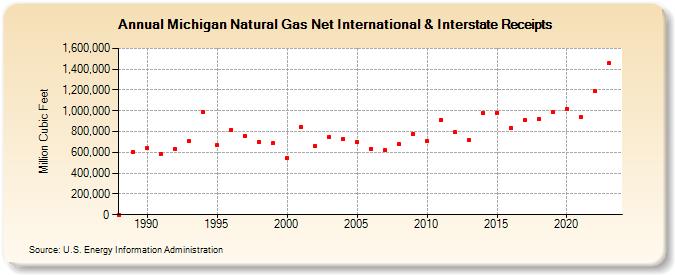
| Michigan Natural Gas Net International & Interstate Receipts (Million Cubic Feet) | |||||
| Decade | Year-0 | Year-1 | Year-2 | Year-3 | Year-4 | Year-5 | Year-6 | Year-7 | Year-8 | Year-9 |
|---|---|---|---|---|---|---|---|---|---|---|
| 1980's | 0 | 607,815 | ||||||||
| 1990's | 641,029 | 579,763 | 628,711 | 708,715 | 991,268 | 666,201 | 819,047 | 756,590 | 703,876 | 686,993 |
| 2000's | 548,023 | 842,671 | 657,622 | 751,490 | 725,310 | 702,085 | 636,291 | 618,613 | 677,356 | 775,340 |
| 2010's | 710,740 | 914,699 | 793,186 | 723,082 | 977,571 | 982,115 | 836,353 | 913,000 | 923,758 | 985,118 |
| 2020's | 1,017,325 | 937,390 | 1,186,873 | 1,456,030 | 1,406,428 |
| - = No Data Reported; -- = Not Applicable; NA = Not Available; W = Withheld to avoid disclosure of individual company data. |
| Release Date: 6/30/2026 |
| Next Release Date: 7/31/2026 |