|
Download Data (XLS File) |
|
|||||
|
|||||
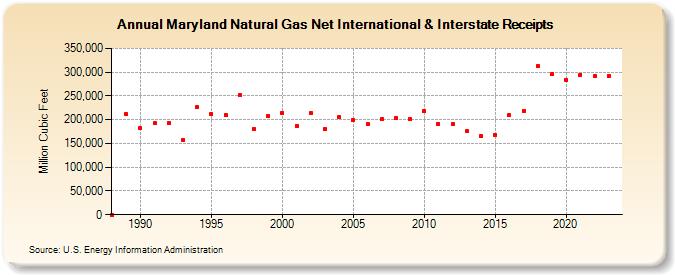
| Maryland Natural Gas Net International & Interstate Receipts (Million Cubic Feet) | |||||
| Decade | Year-0 | Year-1 | Year-2 | Year-3 | Year-4 | Year-5 | Year-6 | Year-7 | Year-8 | Year-9 |
|---|---|---|---|---|---|---|---|---|---|---|
| 1980's | 0 | 211,424 | ||||||||
| 1990's | 181,796 | 192,200 | 192,423 | 157,062 | 226,594 | 212,069 | 210,215 | 251,756 | 180,453 | 207,457 |
| 2000's | 214,110 | 187,592 | 213,692 | 180,209 | 206,100 | 200,031 | 189,942 | 200,930 | 202,608 | 200,625 |
| 2010's | 217,584 | 191,509 | 191,221 | 175,621 | 165,384 | 168,365 | 209,715 | 219,011 | 313,382 | 295,163 |
| 2020's | 284,137 | 294,544 | 290,907 | 292,205 | 282,784 |
| - = No Data Reported; -- = Not Applicable; NA = Not Available; W = Withheld to avoid disclosure of individual company data. |
| Release Date: 6/30/2026 |
| Next Release Date: 7/31/2026 |