|
Download Data (XLS File) |
|
|||||
|
|||||
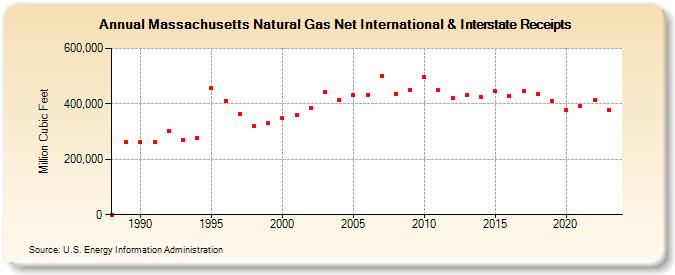
| Massachusetts Natural Gas Net International & Interstate Receipts (Million Cubic Feet) | |||||
| Decade | Year-0 | Year-1 | Year-2 | Year-3 | Year-4 | Year-5 | Year-6 | Year-7 | Year-8 | Year-9 |
|---|---|---|---|---|---|---|---|---|---|---|
| 1980's | 0 | 263,650 | ||||||||
| 1990's | 262,953 | 260,988 | 303,102 | 269,156 | 276,772 | 455,323 | 411,951 | 362,974 | 320,319 | 329,768 |
| 2000's | 347,606 | 359,579 | 385,279 | 444,339 | 415,546 | 431,615 | 432,126 | 500,263 | 436,557 | 450,685 |
| 2010's | 497,228 | 448,837 | 420,440 | 433,063 | 426,226 | 444,972 | 426,717 | 445,007 | 435,095 | 410,185 |
| 2020's | 377,702 | 390,467 | 414,340 | 378,795 | 405,437 |
| - = No Data Reported; -- = Not Applicable; NA = Not Available; W = Withheld to avoid disclosure of individual company data. |
| Release Date: 6/30/2026 |
| Next Release Date: 7/31/2026 |