|
Download Data (XLS File) |
|
|||||
|
|||||
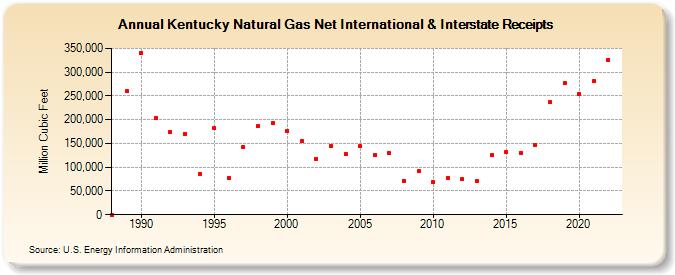
| Kentucky Natural Gas Net International & Interstate Receipts (Million Cubic Feet) | |||||
| Decade | Year-0 | Year-1 | Year-2 | Year-3 | Year-4 | Year-5 | Year-6 | Year-7 | Year-8 | Year-9 |
|---|---|---|---|---|---|---|---|---|---|---|
| 1980's | 0 | 259,514 | ||||||||
| 1990's | 340,002 | 203,548 | 174,733 | 170,567 | 85,965 | 181,693 | 77,379 | 143,416 | 186,793 | 192,574 |
| 2000's | 177,148 | 155,076 | 118,143 | 144,956 | 127,876 | 144,085 | 126,326 | 128,827 | 71,981 | 91,313 |
| 2010's | 69,049 | 78,219 | 75,079 | 70,122 | 125,246 | 132,494 | 130,446 | 146,290 | 237,177 | 276,449 |
| 2020's | 254,460 | 281,456 | 325,440 | 303,143 | 319,254 |
| - = No Data Reported; -- = Not Applicable; NA = Not Available; W = Withheld to avoid disclosure of individual company data. |
| Release Date: 6/30/2026 |
| Next Release Date: 7/31/2026 |